Strategic Group Analysis
Table of Contents
- Introduction: Strategic Group Analysis
- Defining Strategic Groups
- Identifying Strategic Groups
- Analyzing Competitive Dynamics within Strategic Groups
- Implications of Strategic Group Analysis
- Activity: Analyze Generative AI Industry
- Conclusion
Required Preparation
Before starting this lesson, ensure you have:
- Read the assigned reading “Industry Analysis.”
- Completed the “Introduction to Strategy” lesson.
- Completed the “Porter’s Five Forces Analysis” lesson.
- Completed the “PESTLE Analysis” lesson.
Introduction: Strategic Group Analysis
In the previous lessons, we explored the external environment of an industry using Porter’s Five Forces and PESTLE analysis. Five forces analysis helped us understand the nature of competition and its impact on customer willingness-to-pay and industry costs. PESTLE analysis helped us contextualize developments in the broader environment to an industry or a company.
Now, we’ll delve deeper into industry analysis with strategic group analysis. This framework allows us to:
- Identify the key groups of competitors within an industry who pursue similar strategies.
- Analyze the competitive dynamics within and between these groups.
- Understand how external factors (like those identified in PESTLE analysis) and competitive forces (like those identified in Five Forces analysis) might differentially impact various strategic groups.
Strategic group analysis is a powerful tool for understanding the competitive landscape and making informed strategic decisions. It helps us move beyond a general industry analysis to a more nuanced view of competitive rivalry.
Key questions we’ll explore:
- What are strategic groups and how do they differ from broader industry classifications?
- How can we identify and define strategic groups within an industry?
- How can we analyze the competitive dynamics within and between strategic groups?
- How can we use strategic group analysis to inform strategic decision-making?
By the end of this lesson, you will be able to confidently define, identify, and analyze strategic groups within an industry, and understand how this analysis can be used to develop effective competitive strategies.
Defining Strategic Groups
What exactly are strategic groups?
Strategic groups are sets of firms within a specific industry that pursue similar strategies or compete on similar bases. These firms share similar characteristics, such as:
- Similar customer base: They target similar customer segments with their products or services.
- Similar product/service offerings: They offer comparable products or services in terms of features, quality, and price.
- Similar competitive advantages: They compete based on similar strengths, such as brand reputation, technology, or distribution networks.
- Similar value chain configurations: They have similar approaches to activities like production, marketing, and distribution.
A Technique for Understanding a Complex Landscape:
Strategic group analysis helps simplify complex industries by grouping companies with similar business models and strategies, making it easier to understand the competitive landscape. It’s like creating a map of a crowded city, organizing it into neighborhoods based on shared characteristics. This simplification allows for a more focused analysis of rivals, potential customers, and new opportunities.
It’s important to remember that strategic groups are distinct from broader industry classifications. While all firms in a strategic group belong to the same industry, not all firms in an industry belong to the same strategic group. For example, the airline industry includes different strategic groups such as full-service carriers (e.g., Delta, United), low-cost carriers (e.g., Southwest, Spirit), and regional carriers (e.g., Cape Air, SkyWest).
Identifying Strategic Groups
Now that we understand what strategic groups are, let’s explore how to identify them within an industry. This process involves three key steps:
1. Identifying Key Dimensions
First, we need to identify the key dimensions that distinguish firms within the industry. These dimensions should be analytically valuable, meaning they help us understand the competitive landscape and inform strategic decision-making. Additionally, the dimensions should be conceptually distinct and orthogonal to one another, ensuring they capture different aspects of the competitive landscape.
Examples of key dimensions include:
- Product/service quality: High vs. low quality.
- Pricing policies: Premium vs. discount pricing.
- Distribution channels: Direct sales vs. retail distribution.
- Market segmentation: Broad vs. niche market focus.
- Technological leadership: Innovative vs. follower.
- Brand image: Strong vs. weak brand reputation.
- Degree of vertical integration: High vs. low.
- Geographic scope: Local vs. global.
The specific dimensions used will vary depending on the industry being analyzed. For example, in the airline industry, key dimensions might include the type of service offered (full-service vs. low-cost), the route network (hub-and-spoke vs. point-to-point), and the level of vertical integration (owning maintenance facilities vs. outsourcing).
2. Selecting Dimensions for Mapping
Once we have identified a list of key dimensions, we need to select two for mapping the firms. The choice of dimensions depends on the specific analytical goals. For example, if the goal is to identify potential acquisition targets, we might choose dimensions that reflect market share and financial strength. If the goal is to anticipate new market entrants, we might choose dimensions that reflect barriers to entry and technological innovation.
3. Mapping Strategic Groups
The final step is to map the firms on a two-dimensional graph, using the selected dimensions as axes. Firms that are located close to each other on the map belong to the same strategic group. The size of the circles representing each firm can be adjusted to reflect their market share or other relevant metrics.
By visually representing the strategic groups, we can gain a clearer understanding of the competitive landscape and identify potential opportunities and threats.
Creating a Strategic Group Map:
- Choose two key dimensions: Select the two dimensions that are most important in distinguishing firms within the industry and that are not highly correlated with each other.
- Plot the firms: Gather data on each firm’s position on the chosen dimensions and plot them on the graph.
- Identify strategic groups: Look for clusters of firms that are located close to each other on the map. These clusters represent the strategic groups within the industry.
- Analyze the map: Consider the following questions:
- How many strategic groups are there?
- How large is each group?
- How much overlap is there between groups?
- Are there any “isolated” firms that do not belong to any clear group?
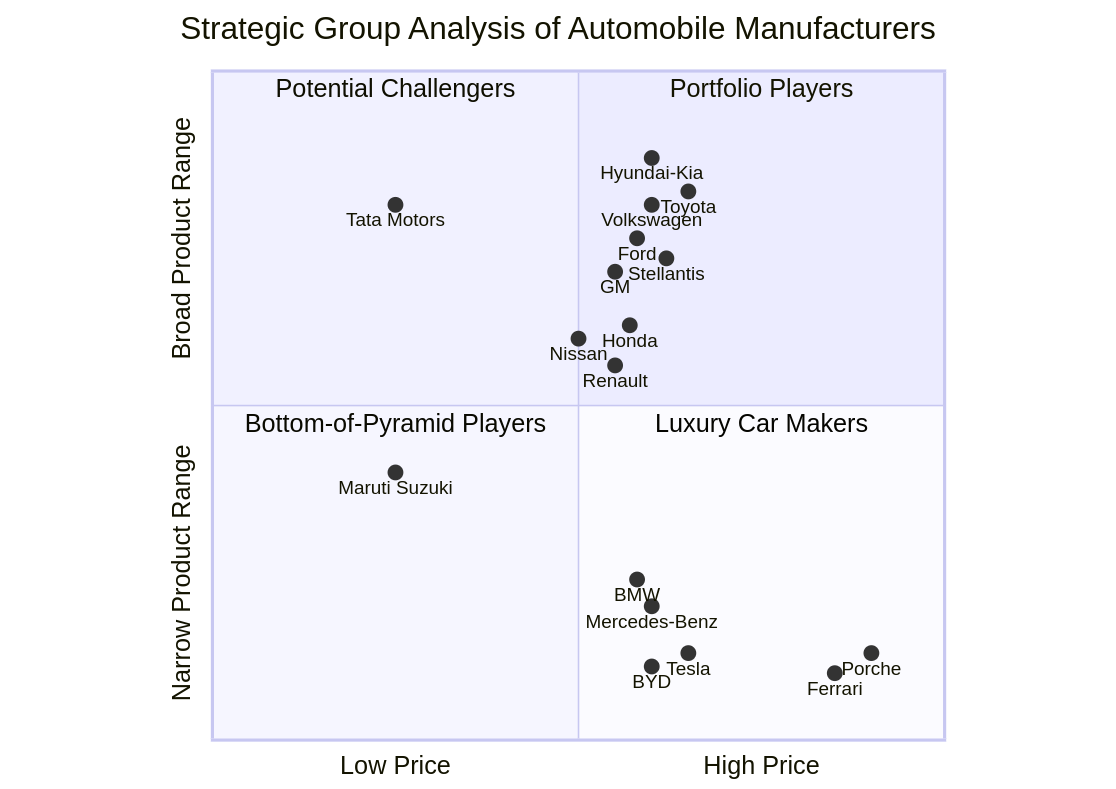
Example of a Strategic Group Map:
Imagine we are analyzing the automobile industry. We might choose “price” and “product range” as our two key dimensions. The resulting strategic group map might look something like this:
Benefits of Strategic Group Mapping:
- Visual representation: Provides a clear and concise overview of the competitive landscape.
- Identifying competitors: Helps to identify direct and indirect competitors.
- Revealing opportunities: Can highlight potential gaps in the market or opportunities for differentiation.
- Understanding mobility barriers: Illustrates the challenges firms face in moving from one strategic group to another.
By using strategic group maps, we can gain a deeper understanding of the competitive dynamics within an industry and identify potential opportunities and threats for individual firms.
Analyzing Competitive Dynamics within Strategic Groups
Once we’ve identified the strategic groups within an industry, we can delve deeper into the competitive dynamics at play. Remember, firms within the same strategic group are more likely to be direct competitors than those in different groups. Analyzing these dynamics helps us understand:
- Intensity of rivalry: How fiercely do firms within a group compete with each other?
- Profit potential: Which groups are more likely to be profitable?
- Mobility barriers: What prevents firms from moving to a more attractive group?
Factors influencing competitive dynamics within strategic groups:
- Number of firms in the group: Groups with fewer firms may experience less intense rivalry, while those with numerous firms may face more intense competition.
- Similarity of strategies: The more similar the strategies of firms within a group, the greater the intensity of rivalry.
- Barriers to entry and exit: High barriers to entry can protect firms within a group from new competitors, while high exit barriers can increase rivalry among existing firms.
- Product differentiation: If firms within a group offer highly differentiated products, rivalry may be less intense. Conversely, if products are similar, competition can be fierce.
- Industry growth rate: In high-growth industries, rivalry may be less intense as there are ample opportunities for all firms. In low-growth or declining industries, competition for market share can be more intense.
- Degree of vertical integration: Firms with similar degrees of vertical integration may face similar cost structures and competitive pressures.
Analyzing competitive dynamics can reveal:
- Threats: Identify the most significant competitive threats within a strategic group.
- Opportunities: Uncover potential opportunities for differentiation or new market entry within a group.
- Mobility barriers: Understand the challenges firms face in trying to move from one strategic group to another. This could involve things like cost disadvantages, brand image limitations, or access to distribution channels.
By carefully analyzing these dynamics, firms can make informed decisions about their competitive strategies and positioning within their respective strategic groups.
Implications of Strategic Group Analysis
Strategic group analysis isn’t just about mapping and understanding the competitive landscape—it’s about leveraging that knowledge to make informed strategic decisions. Here’s how this framework can be put into action:
1. Identifying Threats and Opportunities:
- Competitive Threats: By analyzing the strategies and performance of firms within your strategic group, you can pinpoint potential threats. Are competitors innovating faster? Do they have a cost advantage? Understanding these threats allows you to proactively develop defensive strategies.
- Market Opportunities: Strategic group maps can reveal gaps in the market or underserved customer segments. These gaps can represent opportunities to differentiate your offerings or even create entirely new strategic groups.
2. Developing Competitive Strategies:
- Positioning: Strategic group analysis helps you understand your firm’s current position within the industry and identify potential avenues for repositioning. Should you focus on cost leadership, differentiation, or a niche strategy?
- Resource Allocation: By understanding the competitive dynamics within your group, you can allocate resources more effectively. Should you invest in R&D, marketing, or new production facilities?
- Competitive Advantage: Identify the key success factors within your strategic group and focus on developing sustainable competitive advantages in those areas.
3. Predicting Industry Evolution:
- Emerging Trends: Analyzing the movement of strategic groups over time can help you anticipate future industry trends. Are groups converging or diverging? Are new groups emerging?
- Mobility Barriers: Understanding the factors that prevent firms from moving between groups can help you predict the stability of the industry structure and the likelihood of new entrants.
Integrating with Other Frameworks:
Strategic group analysis is even more powerful when combined with other analytical tools like Porter’s Five Forces and PESTLE analysis.
- Five Forces: Strategic group analysis can help you understand how the five forces affect different groups differently. For example, supplier power might be stronger for one group than another.
- PESTLE: By overlaying PESTLE insights onto your strategic group map, you can see how external factors might impact different groups differently. For instance, a technological change could favor one group over another.
By integrating these frameworks, you can gain a holistic understanding of the competitive landscape and develop more robust and effective strategies.
Activity: Analyze Generative AI Industry
In this activity you will continue your analysis of the generative AI industry using the Strategic Groups Analysis. I strongly recommend that you continue using the industry definition you developed in the previous lesson.
Visit the activity page and complete the activity with your group.
Conclusion
Strategic group analysis is a powerful tool for understanding the competitive landscape of an industry. By identifying strategic groups, analyzing competitive dynamics, and considering the implications for strategic decision-making, firms can gain a competitive advantage.
Key takeaways:
- Strategic groups are sets of firms within an industry that pursue similar strategies or compete on similar bases.
- Strategic group maps are a useful tool for visualizing the competitive landscape and identifying strategic groups.
- Competitive dynamics within and between strategic groups can be influenced by a variety of factors, such as the number of firms in the group, the similarity of strategies, and the barriers to entry and exit.
- Strategic group analysis can be used to identify threats and opportunities, develop competitive strategies, and predict industry evolution.
- Integrating strategic group analysis with other frameworks, such as Porter’s Five Forces and PESTLE analysis, can provide a more comprehensive understanding of the competitive landscape.